Loading page
Client case studyBusiness Intelligence
Business Analytics Platform
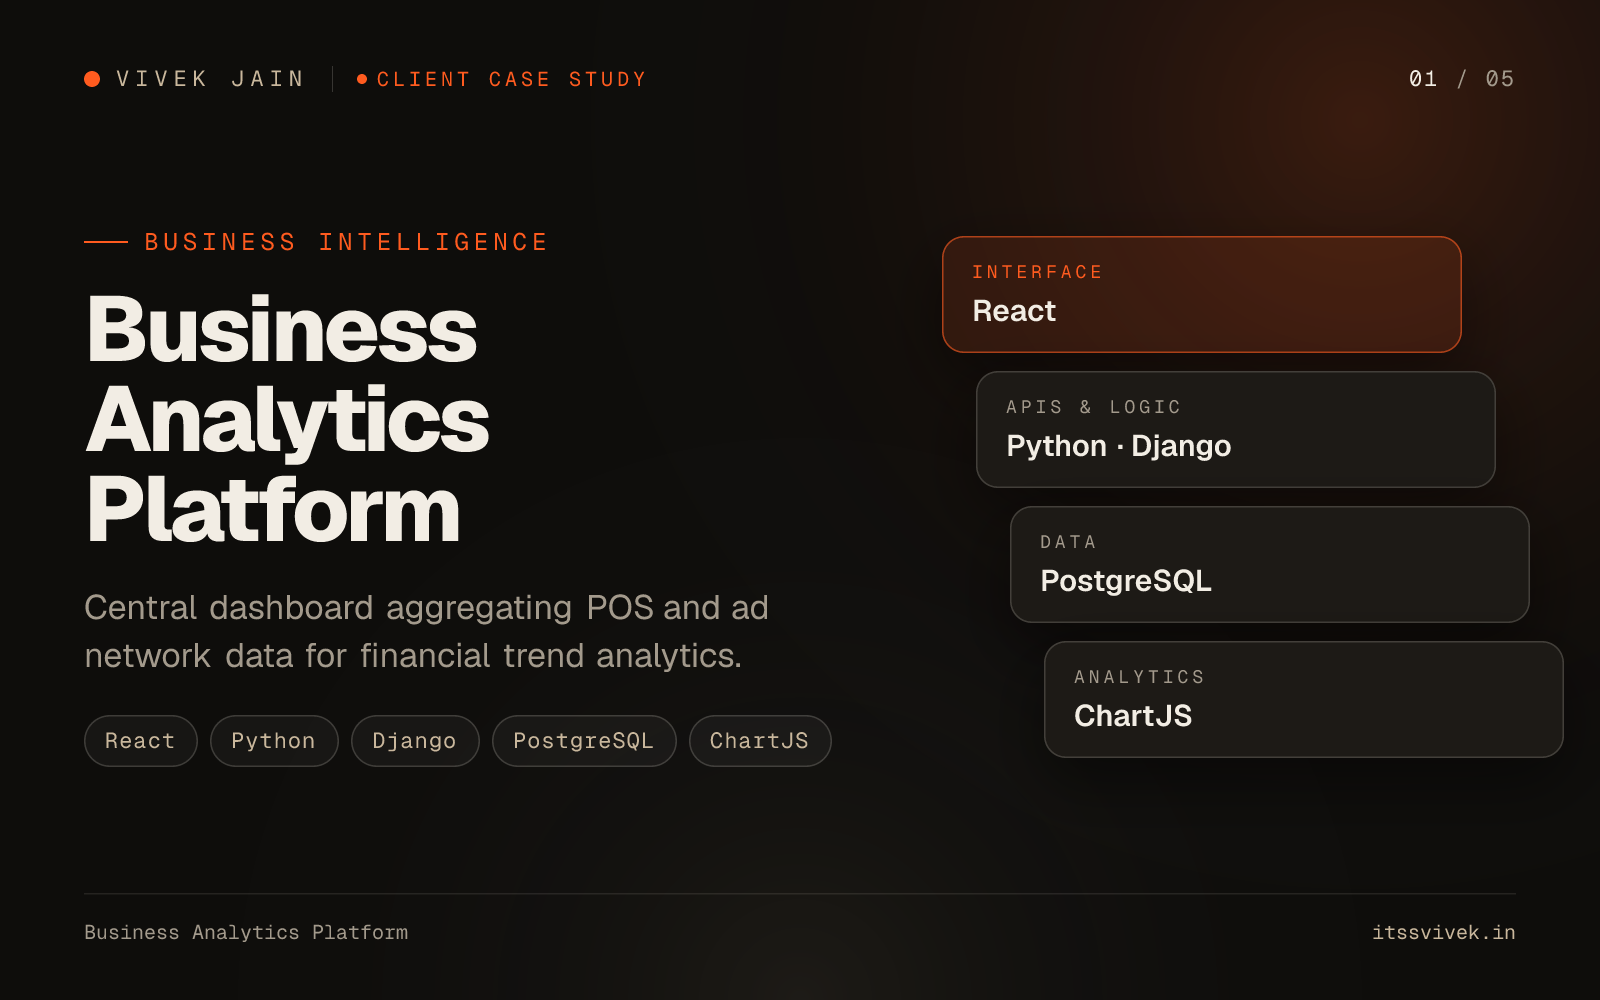
Central dashboard aggregating POS and ad network data for financial trend analytics.
Headline results
- Retention
- +15% return
- Data points
- 10M+
- Budget reclaimed
- 22% ad spend
The project in 5 images
5 summary slides
01Overview
The project at a glance
A business intelligence suite that queries database transaction records to compile operational reports, cashflows, and forecasting charts.
- Type
- Client case study
- Category
- Business Intelligence
Tech stack
- React
- Python
- Django
- PostgreSQL
- ChartJS
02The challenge
What wasn't working
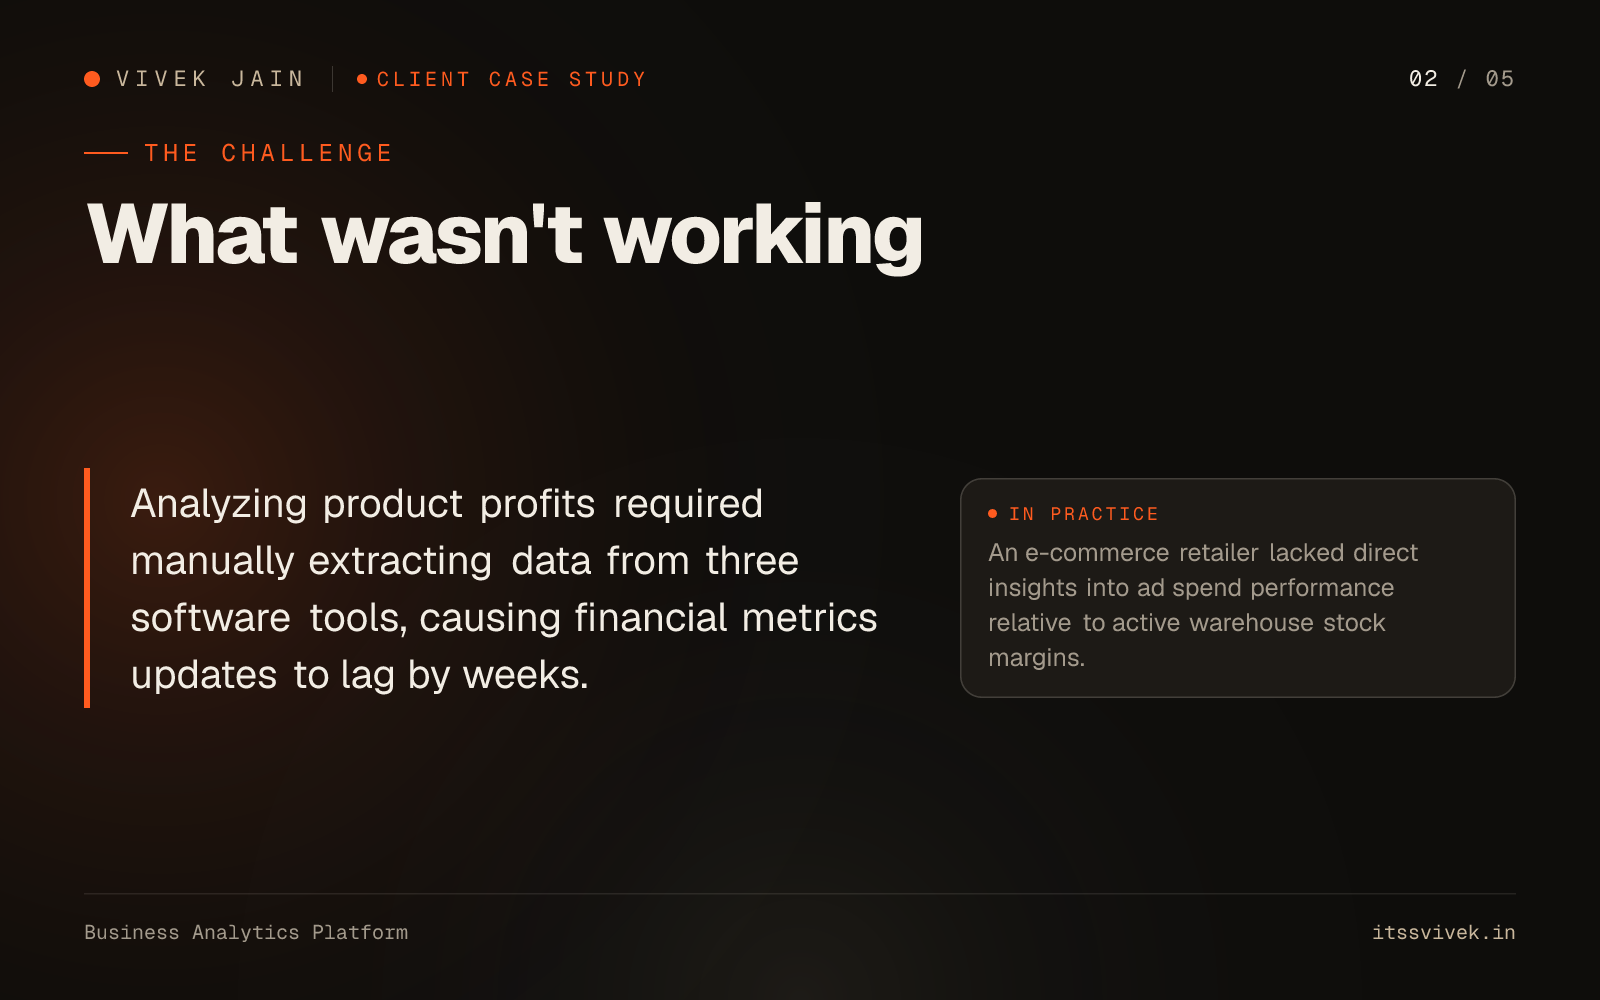
Analyzing product profits required manually extracting data from three software tools, causing financial metrics updates to lag by weeks.
The brief
An e-commerce retailer lacked direct insights into ad spend performance relative to active warehouse stock margins.
03The solution
How it was built
Designed an analytics engine that ingests data from ad nodes and sales systems, compiling margins and trends.
Celery cron workers download daily ad updates, run Python aggregation modules, and save calculations to PostgreSQL tables for instant React rendering.
- InterfaceReact
- APIs & logicPythonDjango
- DataPostgreSQL
- AnalyticsChartJS
04Key features
What it does
- 01Sales performance visualization metrics with calendar filtering.
- 02Customer lifetime value cohort calculators.
- 03Predictive revenue trends using simple linear modeling.
- 04Automated CSV/PDF business performance report compiler.
05Results
What changed
Identified underperforming product lines to reclaim 22% in ad spend and boosted repeat buyers by 15%.
Next step
Need a system like this?
I scope, design, build and launch it end to end, then help you grow it. Tell me what you need.
Back to all work